- Bike Bulletin
- Posts
- How Paris Grew Their Bicycle Traffic
How Paris Grew Their Bicycle Traffic
Plus, a Colorado Trail documentary and Stats for the Nerds
Sam Westby
January 03, 2026

Happy New Year from the Bike Bulletin! If “Ride More” is one of your resolutions, then you’re in the right place. Over the next year, we’ll take you to “I should probably call my mom because the only people I’ve talked to this past week are the Strava AI and bike shop mechanic.”
—Sam Westby @samcwestby
This is a weekly newsletter about bike trips, urban cycling, and a love for two-wheeled transit. The more time you spend on a bike, the better. I share new editions every week, gearing you up for the ride ahead.
Here’s what we have today.
🌍 RIDE: The Colorado Trail
❓ RESEARCH: How Paris Grew Their Bicycle Traffic
📰 NEWS: New funding and ridership numbers
ROUTE ON MY RADAR
Bikepacking the Colorado Trail
Chris from PNW Bikepacking put out another banger. He’s been making adventure videos on YouTube for the past decade, and the Colorado Trail has been his white whale. The CT is around 539 miles (867 km) from Denver to Durango with tons of single track, tons of hike-a-bike, and is best done on a full suspension mountain bike.
In return, you’ll get close encounters with wildlife and epic views in the Rocky Mountains.
The logistics haven’t worked out for me to try my luck at the Colorado Trail, but once they do I want to do it like Chris. 3 friends, ample time, and a good attitude.
Here’s what you’d be getting yourself into on the Colorado Trail.
Denver, Colorado to Durango, Colorado
539 miles (867 kilometers) with 72.5k feet (22.1k meters) of elevation gain
80% unpaved and 55% single track
High point: 13,270 feet (4,045 meters)
FROM THE IVORY TOWER
How Paris Grew Their Bicycle Traffic
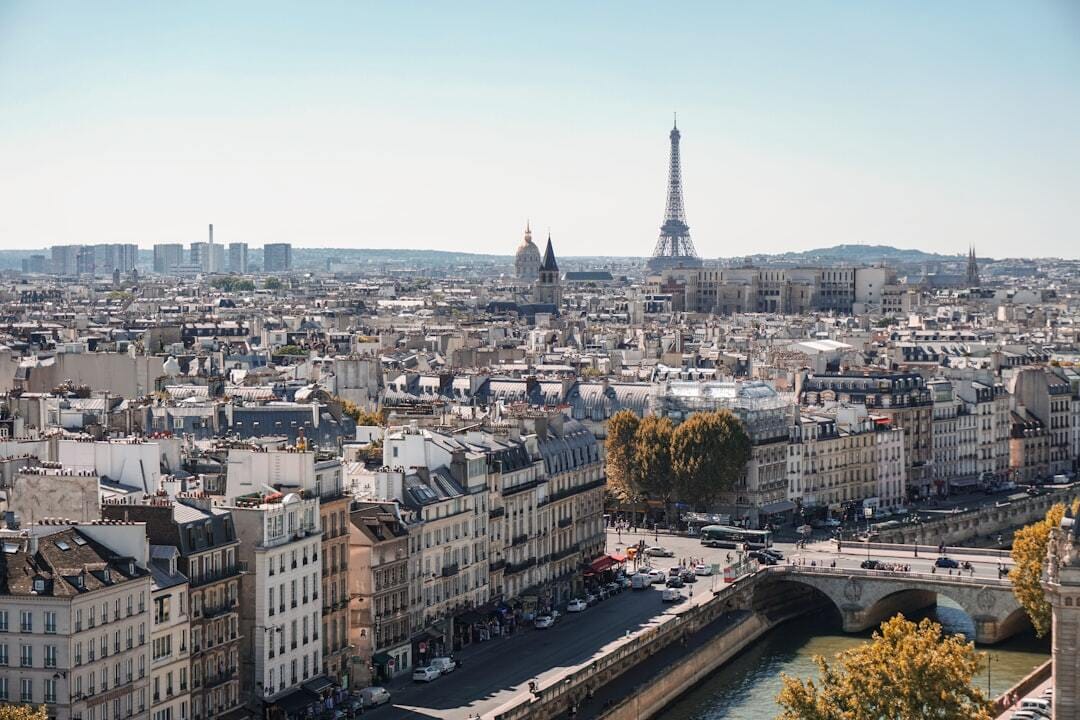
Paris, France, increased their daily bicycle traffic by 240% from 2018 to 2023. They went from 3% of trips taken by bicycle to 11% of trips taken by bicycle. A paper published in the Journal of Cycling and Micromobility Research breaks down why this happened [link to the full article].
These are the top factors explaining the total growth:
Total distance of bicycle lanes (~8.5% of total growth),
Number of bike-share stations (~6% of total growth),
Number of bike parking spots (~6% of total growth),
Fuel price (~5% of total growth),
Low Emission Zones/vehicle restrictions (~4.5% of total growth)
Can Paris’s massive success help you move the needle in your city? Likely yes, if you live in a similarly dense city with many short trips. Focusing on infrastructure first and then restrictions on other modes second could pay massive dividends to your city’s cycling score.
In the coming months, I would like to explore the cultural components that get people to cycle more. That’s something this study didn’t look into, and the authors acknowledge it in a very academic way.
“Certain aspects, such as cultural acceptance or corporate funding for bicycle initiatives, are intrinsically difficult to measure … and are therefore not considered.”
It may be a chicken-and-egg problem. Does infrastructure follow bike culture? Does culture follow infrastructure?
I have no idea, but I know that culture is required and infrastructure is optional (although I’d like to have both). That’s why learning about culture is important.

$42 million. The amount of funding for walking, biking, and transit was announced by the Tennessee Department of Transportation on Monday. (wate.com)
125,000. The number of trips taken on Cincinnati’s Red Bike bike share system in 2025. (WVXU)
Austin, Texas. 50 small businesses in Austin signed a letter asking for bike lanes on the Sixth Street redesign. It’s a pleasant reversal from what we typically hear from local businesses. (KVUE)
A Note From Sam
To share this email, you can forward it or send someone this link: https://bikebulletin.beehiiv.com/subscribe.